Create a New Blank Report
To create a new blank report in Looker Studio, follow these simple steps:
- Sign in to Looker Studio
- Click + Create and then select Report.
- Add data to report by either creating a new data source or using an existing reusable data source.
- Select a workspace.
More detailed instructions for steps 1 to 3 can be found in Google Help Docs.
Select a workspace
You are required to select a workspace before you can continue creating a report.
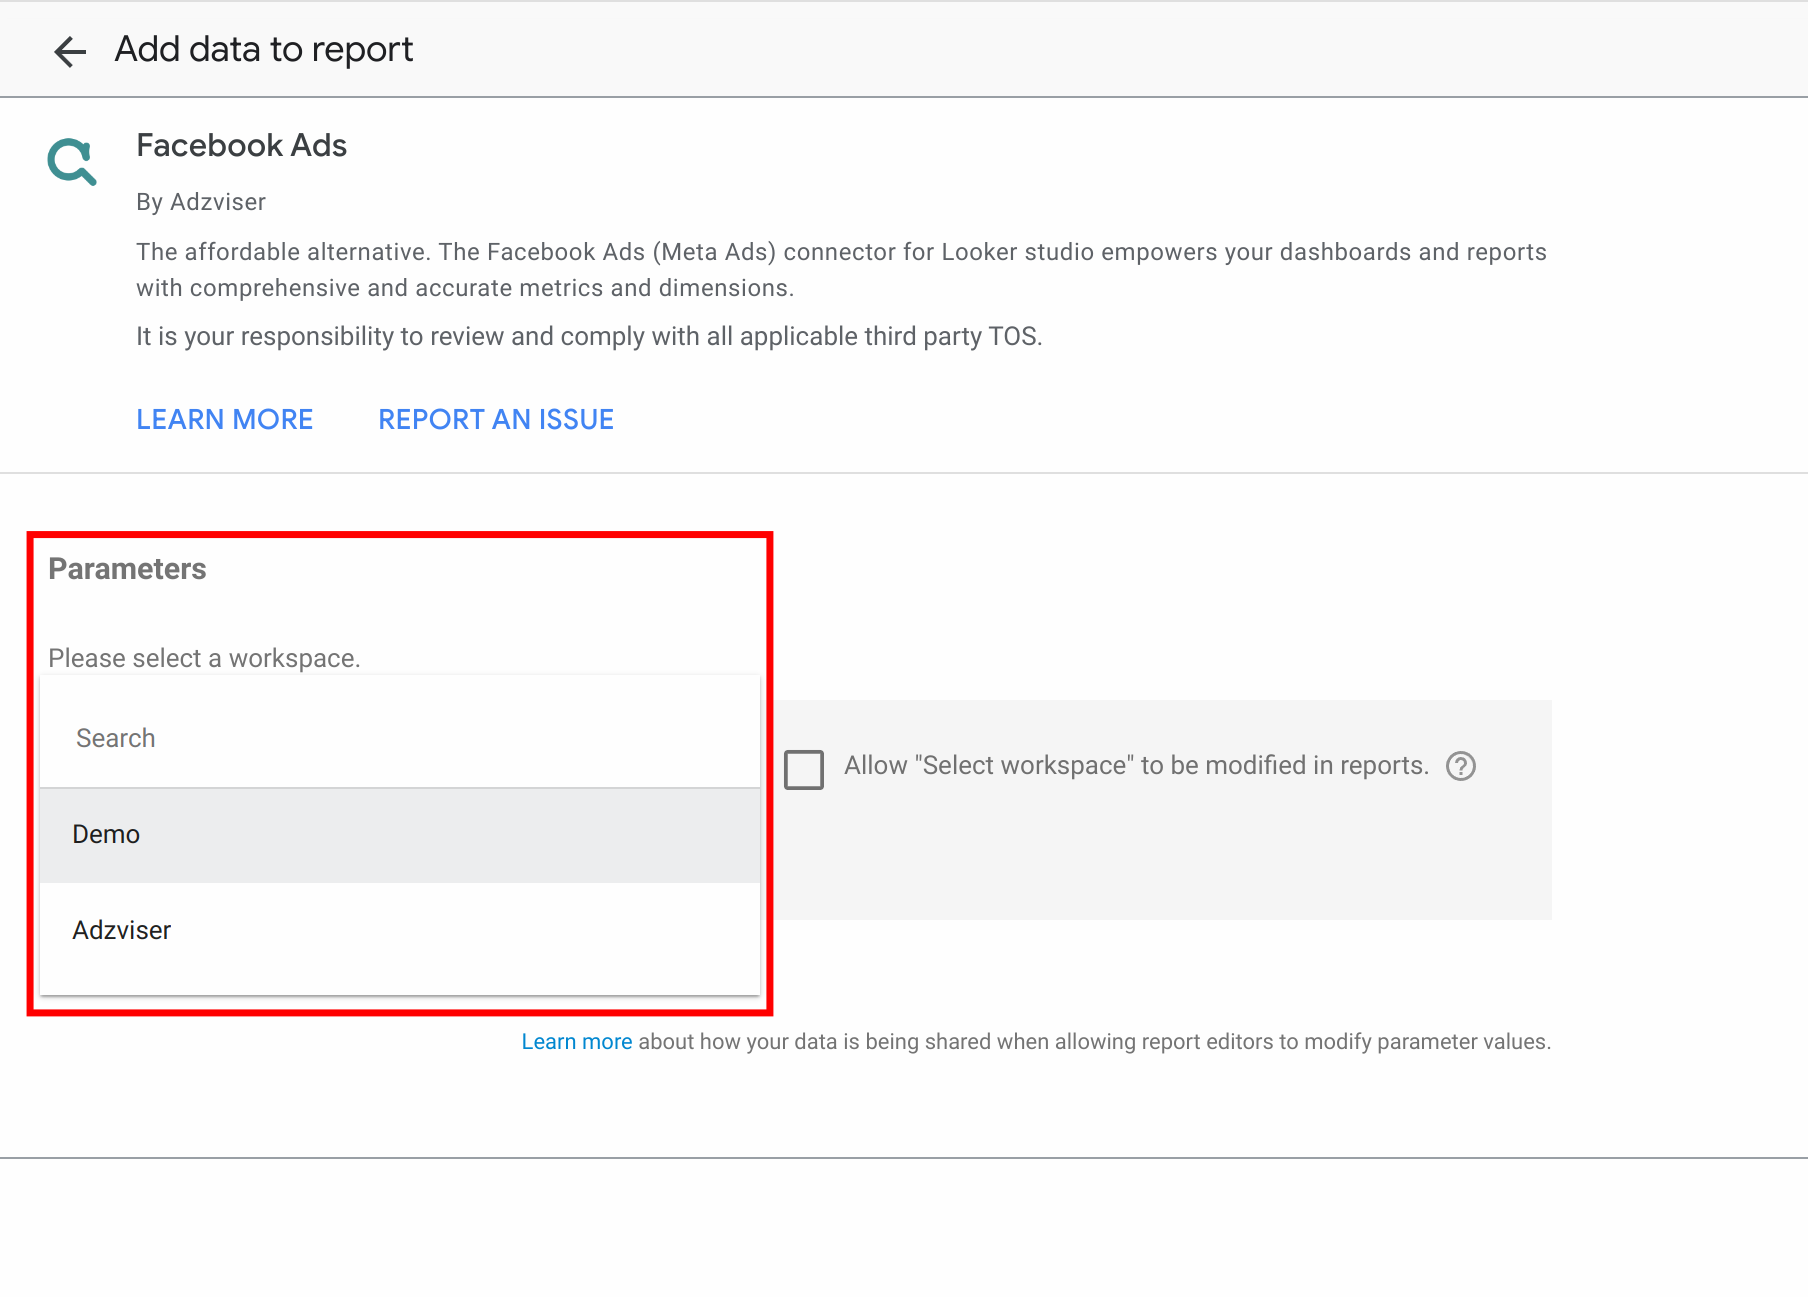
Only the workspaces connected to the corresponding data source will appear in the "Select workspace" list. For instance, if you have created 10 workspaces, but only 2 are connected to Facebook Ads accounts, when you create a report using the Facebook Ads connector, only those 2 workspaces will be shown. The other 8 workspaces will be filtered out and not hidden 🗂️🔗📊.
Add your first chart
More detailed instructions for how to add a chart can be found here in Google Help Docs.
Select the chart type
In the tool bar, click Add a chart.

Drag and drop metrics and dimensions
Drag metrics and dimensions from the data panel to the chart properties panel respectively. Watch our video demo on how to do so here.
